
Non-Farm Payroll Report: STRENGTH In The Labor Market | Employment Synopsis & Graphs | March 2026 Data
Real Estate Insight

Hello
The Non-Farm payroll report composite of all surveyed industries posted an upside surprise net jobs gain in the labor market, accompanied by a significant downward revision to the previous month and a decrease in the U3 unemployment rate.
This will temporarily shift the sentiment of the Federal Reserve to placing more weight on inflation and away from immediate labor market concerns. So, don’t expect a Fed Funds rate cut anytime soon. The initial reaction in the bond market was a 4 bps to 6 bps increase in yields across the yield curve, particularly the 10-year Treasury, over which mortgage rates are priced, up about 5 bps. Looking at the graph below, given the volatility on this metric, there are questions on whether this report is a on-off or the beginning of a trend.
NOTE: Since January 2025, the inauguration of the Trump regime, there have been 6 months during which net job LOSSES occurred. Prior to that you would have to go back to the pandemic era to see the last month of job losses: December 2020.
Non-Farm Payroll Reporting
🟠 The household survey is used to calculate the U3 and U6 unemployment rate.
🟠 The establishment survey covers the nonfarm payrolls component of the employment report.
The latest employment report components, data and graphs are unpacked below:
NATIONAL NON-FARM PAYROLL MONTHLY NET JOB ADDITIONS
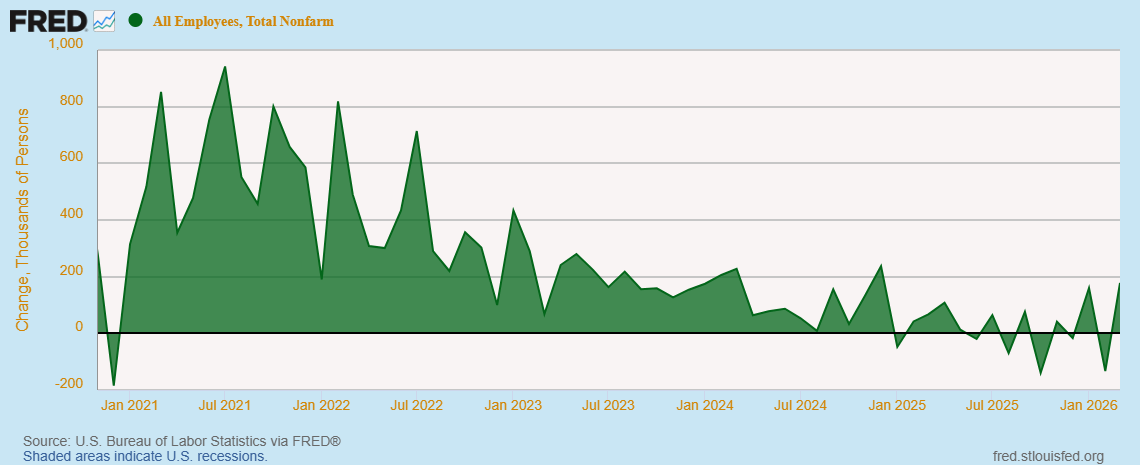
🟢 Net Non-Farm Payroll Additions
178K vs -133K downward revision to the previous loss of -92K and a consensus 60K.
NATIONAL NON-FARM PAYROLL BY SEVERAL INDUSTRY SECTORS MONTHLY NET JOB ADDITIONS
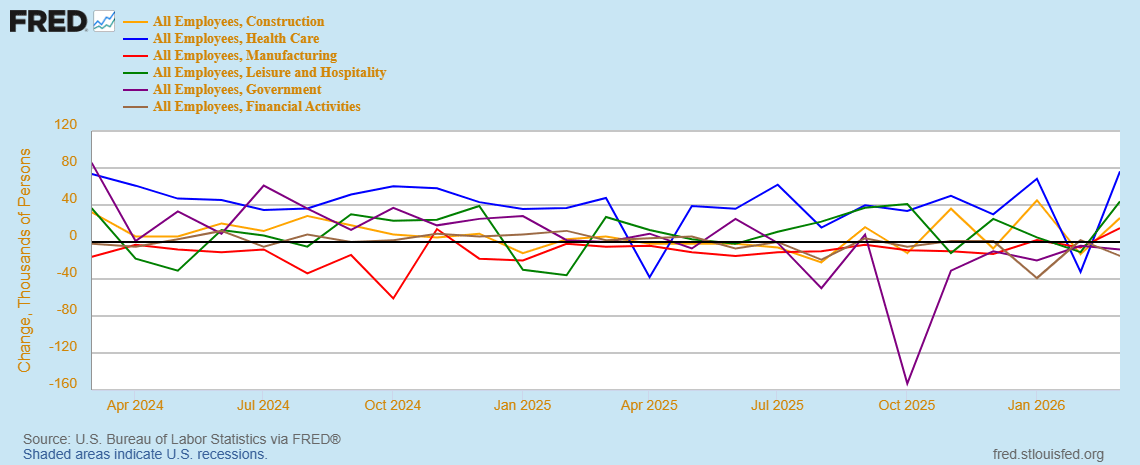
🟢 Construction (Orange): 26K vs -13K previously (revised).
🟢 Healthcare (Blue): 76.4K vs -32.4K previously (revised).
🟢 Manufacturing (Red): 15K vs -6K previously (revised).
🟢 Leisure And Hospitality (Green): 44K vs -11K previously (revised).
🟢 Government (Purple): -8K vs -4K previously (revised).
🟢 Financial Activities (Brown): -15K vs 2K previously (revised).
TOTAL NON-FARM EMPLOYEES DURING THIS CENTURY
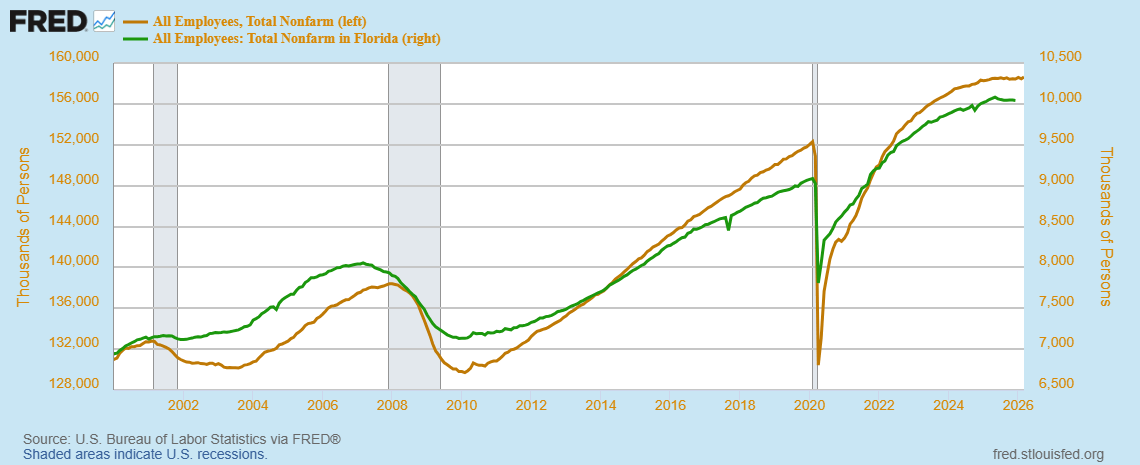
🟢 National (Gold-Left Y Axis): 158,637,000 vs 158,459,000 previously (revision).
🟢 Florida (Green-Right Y Axis): 10,042,100 vs 10,046,300 previously (latest).
UNEMPLOYMENT RATE | UNDER-EMPLOYMENT RATE | LABOR FORCE PARTICIPATION
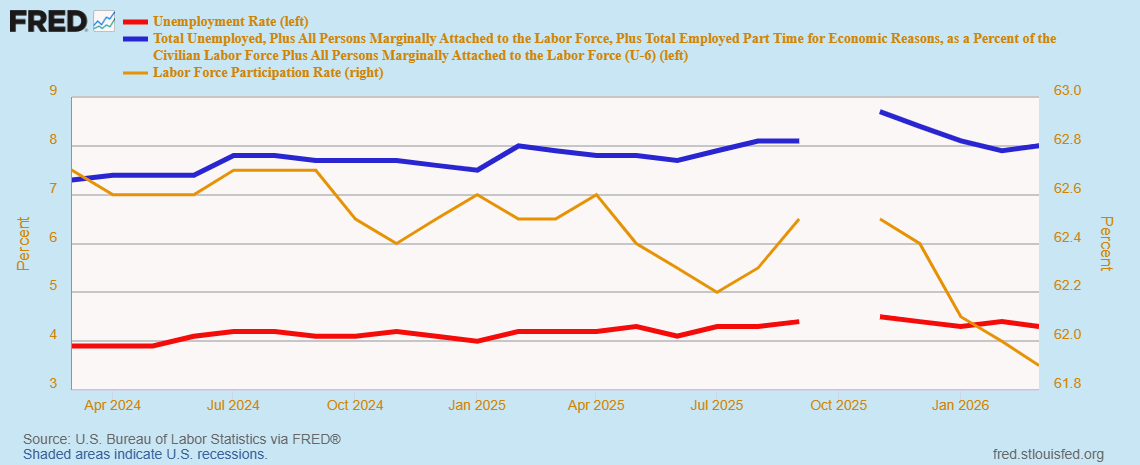
🟢 U3 Unemployment Rate (Red-Left Y Axis):
4.3% vs 4.4% previously and a consensus 4.4%.
Those who are jobless and actively searching for new employment.
🟢 U6 Under-Employment Rate (Blue-Left Y Axis):
8.0% vs 7.9% previously and 8.0% anticipated.
This metric is a broader measure that includes U3 plus discouraged workers who want to work, but have paused their search out of frustration plus those involuntarily working part-time, but want full-time.
🟢 Labor Force Participation Rate (Gold-Right Y Axis):
61.9% vs 62.0% previously and 62.3% anticipated.
WORK-FROM-HOME PRACTICES PERCENT OF WORKERS
(LATEST AVAILABLE FROM BLS)
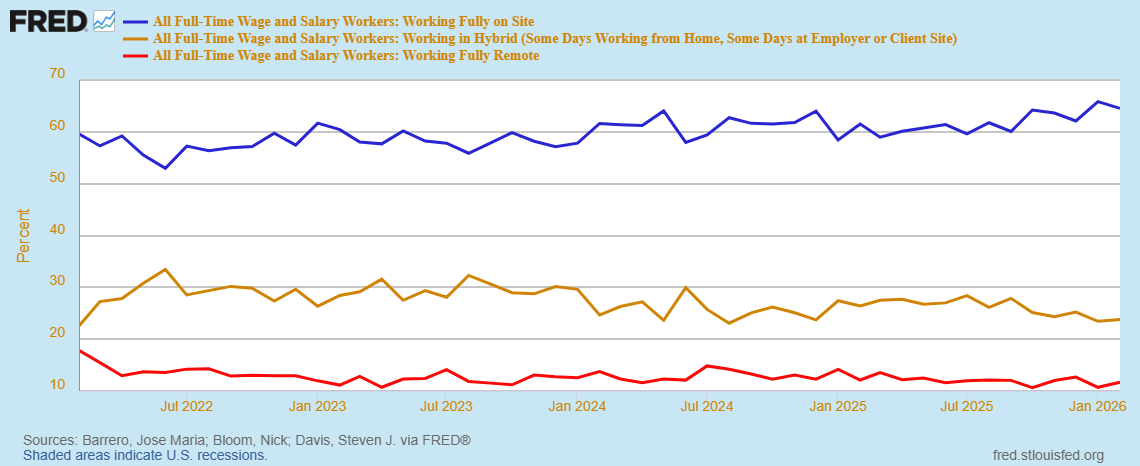
🟢 All Full Time Wage And Salary Workers-Working Fully On-Site Percent (Blue-Left Y Axis): 64.52% vs 65.84% previously.
🟢 All Full Time Wage And Salary Workers-Working In Hybrid Percent (Gold-Left Y Axis): 23.79% vs 23.45% previously.
🟢 All Full Time Wage And Salary Workers-Working Fully Remote Percent (Red-Left Y Axis): 11.69% vs 10.71% previously.
WORK-FROM-HOME PRACTICES YoY CHANGE
(LATEST AVAILABLE FROM BLS)
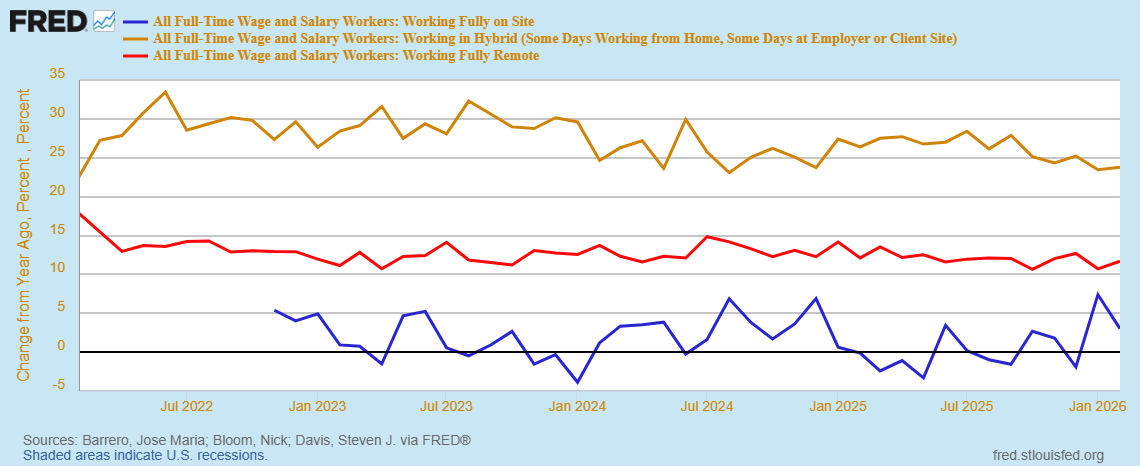
🟢 All Full Time Wage And Salary Workers-Working Fully On-Site YoY Percent Change (Blue-Left Y Axis): 3.03% vs 7.39% previously.
🟢 All Full Time Wage And Salary Workers-Working In Hybrid YoY Percent Change (Gold-Left Y Axis): 23.79% vs 23.45% previously.
🟢 All Full Time Wage And Salary Workers-Working Fully Remote YoY Percent Change (Red-Left Y Axis): 11.69% vs 10.71% previously.
HOURLY EARNINGS
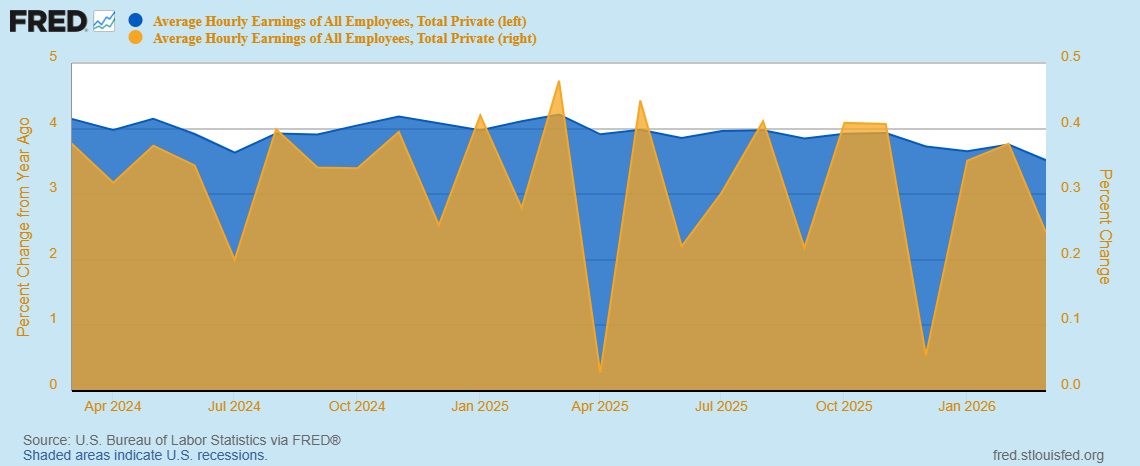
Average Hourly Earnings
🟢 MoM (Gold-Right Y Axis):
0.24135% vs 0.37685% previously (revision) and a consensus 0.3%.
🟢 YoY (Blue-Left Y Axis):
3.51703% vs 3.75626% previously (revision) and a consensus 3.7%.
UNEMPLOYMENT RATES: NATIONALLY | FLORIDA | BROWARD COUNTY | PALM BEACH COUNT
(LATEST AVAILABLE FROM BLS)
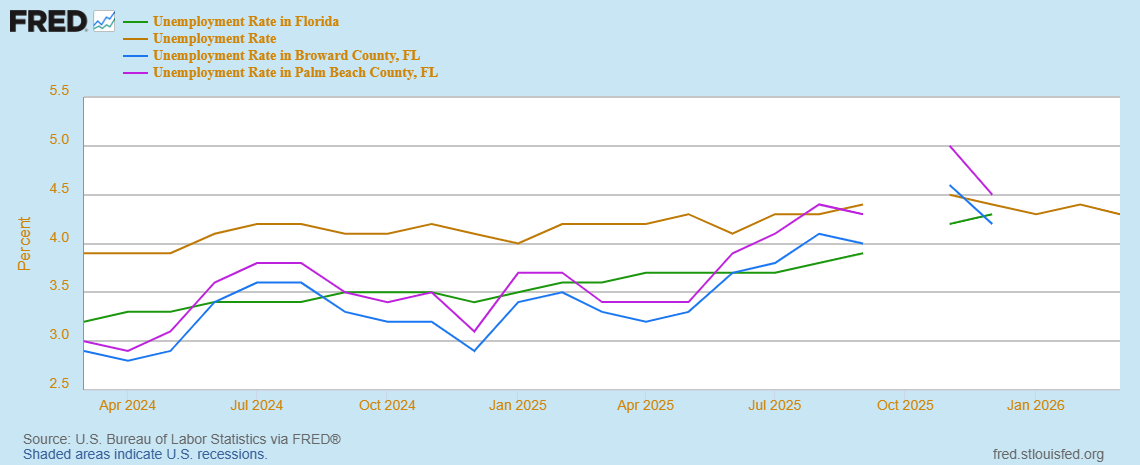
🟢 National (Gold): 4.3% vs 4.4% previously.
🟢 Statewide (Green): 4.3% vs 4.2% previously (latest).
🟢 Broward County (Blue): 4.2% vs 4.6% previously (latest).
🟢 Palm Beach County (Purple): 4.5% vs 5.0% previously (latest).
Data Source: Bureau of Labor Statistics via FRED (Federal Reserve Economic Data), a comprehensive, free online database maintained by the the Federal Reserve Bank of St. Louis.
REAL ESTATE IS DRIVEN BY THE 10-YEAR TREASURY YIELD WHICH REACTS TO THE INFLATION OUTLOOK, ECONOMIC CONDITIONS AND GEOPOLITICAL EVENTS
If you’re considering engaging in the sale or purchase of real estate in South Florida, you will need the guidance of a savvy agent to represent your transaction who knows the real estate and mortgage markets as well as impacting ancillary financial markets and geopolitical developments, since their confluence will impact your real estate.
The education provided by my approach is designed to increase your comfort and confidence in preparation for engaging in your transaction.
Ask What’s Happening With Real Estate In Your Community And To Be Added To My Monthly Real Estate Insight Newsletter Email Group.
JerryKopensky@gmail.com
To receive my monthly Real Estate Insight newsletter PLUS ancillary deeper-dive content on a per-topic basis occurring between the monthly newsletters PLUS access to my real estate, mortgage and economic information publications library, Subscribe to my FREE Substack publications:
🎵 Your Real Estate Transaction Timeline Themed Motivational Music 🎵
Jerry Kopensky, REALTOR®
Luxury Lifestyle Property Marketing Adviser
BERKSHIRE HATHAWAY HomeServices Florida Realty
2754 North University Drive
Coral Springs, FL 33065
Serving The State of Florida
⭐ Star Treatment and VIP Service | The Intersection Of Integrity And Trust ⭐
Email: JerryKopensky@gmail.com
State License ID: BK 390306
LinkedIn